Grading scale chart: the most common value for each letter
The chart gives, letter by letter, the grade points most verified college scales give each letter, the lowest percentage most of the 94 scales that print percentages use, and how many scales use each value. It is a composite, and no college has to use it. The most common complete scale is whole letters only, A 4, B 3, C 2, D 1 and F 0, at 439 scales. Taken as a whole, the chart’s plus/minus columns are one college’s published table, Bronx Community College’s. The other 887 scales print no percentages at all.
| Letter | Grade points (most common) | Also printed as | Lowest % on plus/minus scales | Lowest % on whole-letter scales |
|---|---|---|---|---|
| A+ | 4.0 (91 of 105) | 4.33 (8), 4.3 (6) | 97 (5 of 8) | — |
| A | 4.0 (978 of 979) | 5 (MIT) | 93 (35 of 53) | 90 (40 of 41) |
| A− | 3.7 (304 of 478) | 3.67 (167) | 90 (44 of 46) | — |
| B+ | 3.3 (296 of 514) | 3.33 (168), 3.5 (36) | 87 (41 of 53) | — |
| B | 3.0 (978 of 979) | 4 (MIT) | 83 (39 of 53) | 80 (40 of 41) |
| B− | 2.7 (304 of 478) | 2.67 (168) | 80 (44 of 46) | — |
| C+ | 2.3 (296 of 514) | 2.33 (168), 2.5 (36) | 77 (41 of 53) | — |
| C | 2.0 (978 of 979) | 3 (MIT) | 73 (33 of 53) | 70 (40 of 41) |
| C− | 1.7 (265 of 428) | 1.67 (155) | 70 (37 of 39) | — |
| D+ | 1.3 (248 of 420) | 1.33 (138), 1.5 (21) | 67 (29 of 38) | — |
| D | 1.0 (975 of 977) | 2 (MIT), 0.7 (Utah) | 63 (17 of 21 with a D−); 60 (29 of 31 without) | 60 (38 of 40) |
| D− | 0.7 (190 of 302) | 0.67 (103) | 60 (19 of 21) | — |
| F (or E) | 0 (every one with a value) | — | below 60 (48 of 53) | below 60 (38 of 41) |
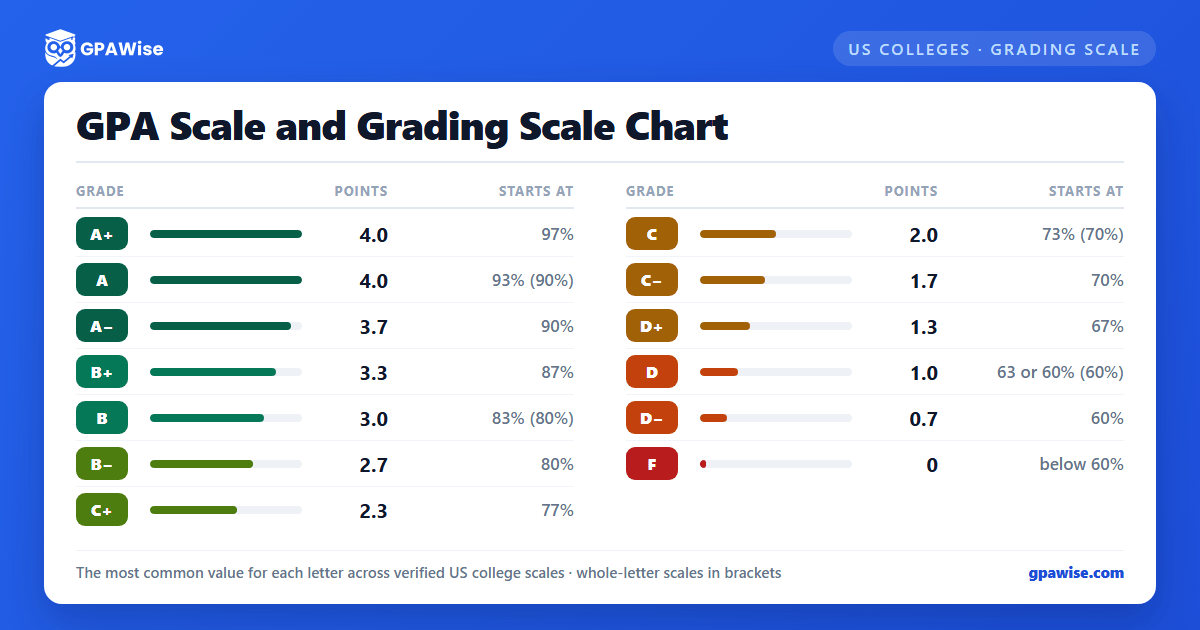
Is there a standard grading scale?
No. The U.S. Department of Education says so directly: “There is no nationally mandated grading scheme in the United States.” Each college or university publishes its own table, and those tables disagree in at least three places: what a plus or a minus is worth, whether there is an A+ and what it counts, and the percentage where each letter starts.
Search results present one chart as the US scale: an A from 93 down to a D+ from 67, then a D from 65 to 66, an F below 65 and no D−. It matches none of the 53 verified plus/minus scales that print bands. The closest on the failing line, ECPI University’s, has the same cut-offs from A to C− and fails below 65 as that chart does, but has no D+: its D runs from 65 to 69. An F below 65 is real, at 5 of the 94 banded scales; below 60 is the most common failing line, at 86.
The charts on the pages that rank disagree with each other too: one starts the A at 93, another at 94, and another prints an A worth 3.9, which no verified scale does.
Letter grade scale: what each letter is worth in grade points
A is 4, B 3, C 2, D 1 and the failing grade 0 almost everywhere: an A is worth 4 at 978 of the 979 verified scales that list it, and a D 1 at 975 of 977. The differences are in the plus and minus.
Of the 978 scales on a letter 4.0 scale, 458 use whole letters only. The other 520 price a sign, and they do it in four ways. Tenths, with a B+ of 3.3 and an A− of 3.7, at 296 scales, UCLA and Cornell among them. Thirds, 3.33 and 3.67, at 169, among them UT Austin and Fairfield. Halves, one grade of 3.5 between B and A, at 42, as at Rutgers–New Brunswick. Another step at 13. A D− carries grade points at 302 scales and a D+ at 420.
So a B+ on a transcript is 3.3 at one college, 3.33 at another and 3.5 at a third. What that does to an average is worked through on the GPA calculator without credits.
| Convention | B+ | A− | Scales | Examples |
|---|---|---|---|---|
| Whole letters only | — | — | 458 | Athens Technical College |
| Tenths | 3.3 | 3.7 | 296 | UCLA, Cornell |
| Thirds | 3.33 | 3.67 (167 scales; Memphis 3.84) | 169 | UT Austin, Fairfield |
| Halves | 3.5 | usually none | 42 | Rutgers–New Brunswick |
| Another step | 3.4 (7), 3.25 (4), 3.75 (1), 3.35 (1) | — | 13 | — |
| Total on a letter 4.0 scale | 978 | Not on one: MIT, Michigan State, Bristol Community College |
A+, F and the odd values
An A+ carries grade points at 105 of the 981 verified scales: 91 count it 4.0, like an A, and 14 count it higher, 4.3 at six (Stanford and Cornell among them) and 4.33 at eight (Arizona State and Columbia among them).
A grade above 4.0 does not by itself make a GPA above 4.0. Arizona State prices an A+ at 4.33, yet “the cumulative GPA is capped at 4.00”. Stanford says it “uses a 4.3 scale”. For the other 12 listings, the published table gives values only.
The failing letter is F at 921 and E at 50, Arizona State and Kentucky’s community and technical colleges among them; 12 print it under another label or with no points. Outside the 4.0 pattern, MIT grades on a 5.0 scale, Utah’s D is 0.7 and Memphis’s A− 3.84; Duke’s D− and New Mexico State’s D+, D and D− are all 1.0.
A grade point carries no percentage of its own: the percentage belongs to the letter, and only on scales that print bands. To convert one overall figure, start from a percentage or start from a GPA.
Grading scale percentages: where each letter starts
Most registrars print no percentage at all: 887 of the 981 verified scales run from letter to grade points only. The U.S. Department of Education describes grading as “usually up to the individual faculty member or disciplinary department”.
The 94 scales that do print bands split two ways. On the 41 whole-letter scales, the A starts at 90 at 40 of them. On the 53 plus/minus scales, the most common starting points are A 93, A− 90, B+ 87, B 83, B− 80, C+ 77, C 73, C− 70 and D+ 67. The D depends on the bottom of the scale: where there is a D−, the D starts at 63 at 17 of 21; where there is none, it starts at 60 at 29 of 31.
Some bands are guidance rather than rule. Queens College heads its table “Suggested Grading Scale”. The table below is the percentage half of the chart, with every other starting point the verified scales print and how many print it.
| Letter | Plus/minus scales: most common lowest % | Other lowest % printed | Whole-letter scales: most common lowest % | Other |
|---|---|---|---|---|
| A+ | 97 (5 of 8) | 98 (2), 95 (1) | — | — |
| A | 93 (35 of 53) | 90 (7), 94 (7), 95 (3), 96 (1) | 90 (40 of 41) | 91 (1) |
| A− | 90 (44 of 46) | 91 (1), 92 (1) | — | — |
| B+ | 87 (41 of 53) | 85 (5), 88 (3), 87.1 (1), 86.7 (1), 86 (1), 89 (1) | — | — |
| B | 83 (39 of 53) | 80 (7), 84 (5), 83.3 (1), 86 (1) | 80 (40 of 41) | 81 (1) |
| B− | 80 (44 of 46) | 81 (1), 83 (1) | — | — |
| C+ | 77 (41 of 53) | 75 (6), 78 (3), 77.1 (1), 76 (1), 80 (1) | — | — |
| C | 73 (33 of 53) | 70 (14), 74 (5), 77 (1) | 70 (40 of 41) | 71 (1) |
| C− | 70 (37 of 39) | 71 (1), 74 (1) | — | — |
| D+ | 67 (29 of 38) | 65 (5), 68 (2), 67.1 (1), 71 (1) | — | — |
| D, with a D− | 63 (17 of 21) | 64 (3), 68 (1) | — | — |
| D, no D− | 60 (29 of 31) | 65 (1), 63 (1) | 60 (38 of 40) | 65 (2) |
| D− | 60 (19 of 21) | 61 (1), 65 (1) | — | — |
Two complete scales colleges publish
Two complete sets of cut-offs lead among the 94 banded scales, both quoted below as published. The 10-point set, an A from 90, B from 80, C from 70 and D from 60, is printed by 38 scales; Athens Technical College’s is the example. The plus/minus set with eleven cut-offs, an A from 93 down to a D+ from 67, a D from 63 and a D− from 60, is printed by 12; Champlain College’s is the example, with its points in thirds. Together they are 50 of the 94. The other 44 scales print 31 other sets.
| 10-point set | Plus/minus set with eleven cut-offs | |
|---|---|---|
| Scales printing it | 38 of 94 | 12 of 94 |
| Example, as published | Athens Technical College: “90-100 A 4 80-89 B 3 70-79 C 2 60-69 D 1 0-59 F 0” | Champlain College: “A (93+) … 4.00 A- (90-92) 3.67 B+ (87-89) 3.33 … D+ (67-69) 1.33 D (63-66) 1.00 D- (60-62) 0.67 F (Below …” |
| Points | whole letters | thirds at Champlain; the set itself is cut-offs only |
What letter is a percentage?
It depends on the scale. Across the 94 banded scales, 93% is an A at 83 and an A− at 11; 70% is a C at 54 and a C− at 37; 67% is not a C on any of them. Where a score has decimals, only the scale’s own rounding rule places it, and some colleges’ bands run to two decimals. Read exactly, 89.5% is a B+ on all 53 plus/minus scales and a B on all 41 whole-letter ones; a scale that rounds first reads it as 90.
| Percentage | Letter, with the number of scales giving it |
|---|---|
| 97% | A at 88, A+ at 6 |
| 95% | A at 92, A+ at 1, A− at 1 |
| 93% | A at 83, A− at 11 |
| 92% | A at 48, A− at 46 |
| 90% | A at 47, A− at 44, B+ at 2, B at 1 |
| 87.5% | B+ at 49, B at 45 |
| 87% | B+ at 48, B at 46 |
| 83% | B at 87, B− at 7 |
| 80% | B at 47, B− at 44, C+ at 2, C at 1 |
| 75% | C at 87, C+ at 6, C− at 1 |
| 72% | C at 55, C− at 38, D+ at 1 |
| 70% | C at 54, C− at 37, D at 2, D+ at 1 |
| 69% | D at 56, D+ at 37, F at 1 |
| 67% | D at 58, D+ at 34, F at 1, D− at 1 |
| 65% | D at 87, D+ at 5, F at 1, D− at 1 |
| 60% | D at 67, D− at 19, F at 8 |
| 59% | F at all 94 (three print the failing row with a second label) |
Is a D passing? Scales can differ by program
A D carries grade points on the scales that list it, 1.0 at 975 of 977, but whether it passes a course, earns credit or meets a requirement is each institution’s and program’s rule. Queens College calls a D “the lowest passing grade in the undergraduate division”. UW Bothell’s nursing school requires a 2.0 in its core courses.
One catalog can print several scales. United States University, not among the verified scales counted here, prints three in its 2022-2023 catalog: a general scale with an A from 94 and an F at 59.99 or below, and two nursing scales with an A from 95, where the F is 73.99 or below for undergraduates and 79.99 or below for graduate students. It sets a minimum passing grade per program: a C+ for the MBA, a C for the BSN, and a B for the MSN and the DNP.
Among the 94 banded college scales, the failing line falls below 60 at 86, below 65 at 5, below 70 at 1, and below 61 and below 63 at one each.
Do high schools use the same scale?
There is no national high school scale either. Four official documents publish the same letter cut-offs, an A from 90, B from 80, C from 70 and D from 60: North Carolina’s, South Carolina’s, Tennessee’s from 2022-23 and Howard County’s in Maryland. NCES applies the same bands to numeric grades. They change. Before 2016, South Carolina used an A from 93, B from 85, C from 77 and D from 70, the set some pages call the “7-point” scale, and Tennessee used yet another until 2022-23.
Grade points differ as well. North Carolina, Tennessee and Howard County give the letters 4, 3, 2, 1 and 0; South Carolina computes points from the numeric average instead. None of these documents gives a plus or a minus its own value. The University of California, Georgia’s HOPE scholarship and the NCAA ignore the sign, while Minnesota’s official calculator prices it. College Board’s chart prints a D from 66 and an E/F below 65.
Weighting differs too: Howard County, North Carolina and South Carolina give an extra 0.5 for an honors class and 1.0 for AP, while Tennessee adds percentage points instead. For a high school average, use the high school GPA calculator.
Where these figures come from
Each count on this page is of the 981 verified grading scales of US colleges and universities on GPAWise, each checked against the institution’s own published document, and counted on October 16, 2026. A few institutions are listed twice, and each listing counts once; counted once per published document instead, every finding keeps its order and its rounded size. No high schools are counted. 21 more US institutions on GPAWise have no verified scale yet and are left out. The figures move when a scale is re-verified.
The table lists every college this page names, what its own table shows, and where to read it: the registrar’s page and the college’s GPAWise calculator, which runs on the same verified scale.
| Institution | What its table shows | GPAWise calculator |
|---|---|---|
| UCLA | tenths; an A+ of 4.0, “the same number of grade points as the A grade” | UCLA GPA calculator |
| UT Austin | thirds; no A+ | UT Austin GPA calculator |
| Rutgers–New Brunswick | halves; a B+ of 3.5 | Rutgers GPA calculator |
| MIT | a 5.0 scale | MIT GPA calculator |
| Stanford | “a 4.3 scale”; an A+ of 4.3 | Stanford GPA calculator |
| Cornell | an A+ of 4.3; tenths | Cornell GPA calculator |
| Arizona State | an A+ of 4.33; E for failure; cumulative GPA capped at 4.00 | Arizona State GPA calculator |
| Fairfield | thirds; bands from an A at 93 to a D at 60 | Fairfield GPA calculator |
| Queens College, CUNY | “Suggested Grading Scale”; a D is “the lowest passing grade” | Queens College GPA calculator |
| Champlain College | the plus/minus set with eleven cut-offs | Champlain GPA calculator |
| Athens Technical College | the 10-point set | Athens Tech GPA calculator |
| University of Utah | a D of 0.7 | Utah GPA calculator |
| University of Memphis | an A− of 3.84 | Memphis GPA calculator |
| Duke | a D− of 1.0 | Duke GPA calculator |
| New Mexico State | a C− of 2.0; D+, D and D− all 1.0 | New Mexico State GPA calculator |
| ECPI University | the closest to the corrected chart on the failing line (F below 65); no D+ | ECPI GPA calculator |
| Bronx Community College, CUNY | the chart’s plus/minus columns as one published table | Bronx Community College GPA calculator |