How to convert your GPA to a percentage
Start with your institution's own grading scale rather than a formula. Any registrar that awards grade points also publishes the percentage band each letter represents, and that table is the conversion — the work is a lookup, not a calculation.
Find the letter your grade point corresponds to. A 3.67 is an A− at Fairfield University with a band of 90–92%; at Ave Maria University the A− is 3.70 and carries the same 90–92%. That agreement is coincidence rather than a standard, which is why the table you read has to be your own institution's.
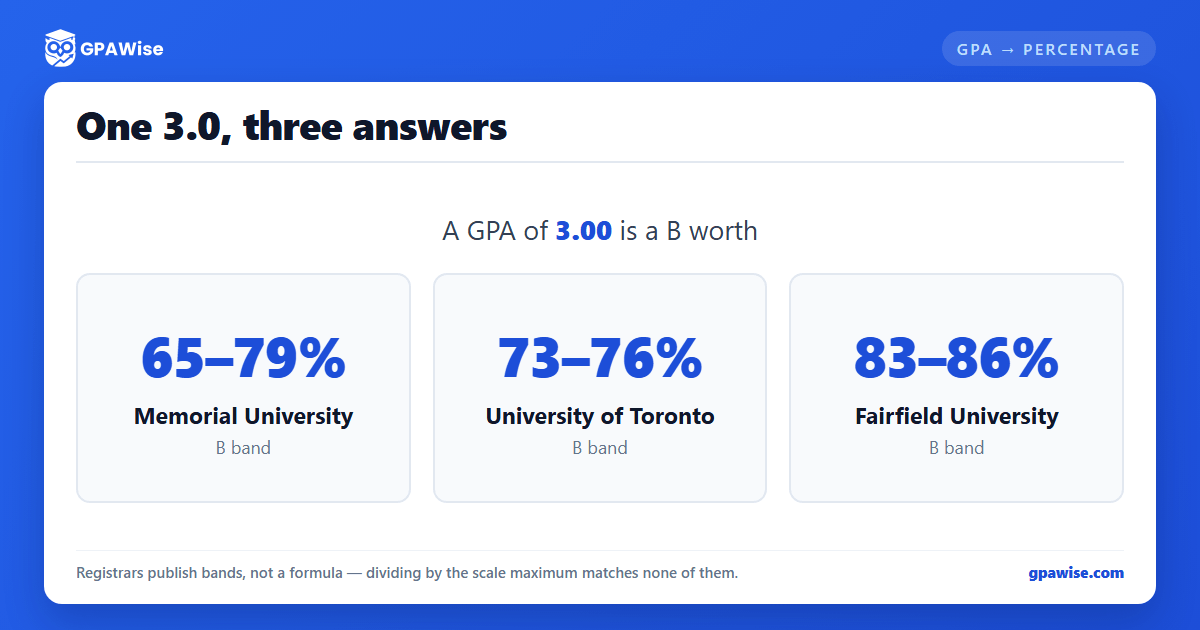
Application forms rarely accept a range. Where a single figure is required, take the bottom of the band — the convention Pakistan's HEC writes into its own policy, which awards a student “the minimum of the corresponding percentage” for any CGPA. A 3.0 at Fairfield is a B, the B band runs 83–86%, and the reported figure is 83%.
If your institution publishes no band table, you are estimating rather than converting — and the gap between those two things is wider than it looks.
- Open your institution's grading policy, academic calendar or transcript key and find the table mapping letter grades to grade points.
- Locate the row whose grade point matches yours and note the letter.
- Read that row's percentage band — that range is your conversion.
- Where a form needs one figure, report the band minimum.
Source: HEC Policy Guidelines, §13.1 — a CGPA is assigned the minimum percentage of its grade band (3.00 → 71%).
Why “divide by 4 and multiply by 100” gets it wrong
The rule every converter repeats — Percentage = (GPA ÷ scale maximum) × 100 — rests on an assumption no registrar makes: that the top of a scale means 100%. A 4.0 is the grade point attached to an A, and an A begins at 93% at Fairfield University, 90% at Clark Atlanta University, and 80% at Memorial University of Newfoundland.
The error compounds downwards. The rule calls a 1.0 25%, a catastrophic fail. At every verified United States institution in our data a 1.0 is a D — a passing grade banded between 60% and 69%. Memorial reads 50–54%, the University of Toronto 53–56%. The rule misses by 25 to 44 percentage points and turns a pass into a failure.
This is more than a technicality. Several converters ranking for this term publish a band chart that contradicts the formula they open with — in one case by more than 40 points at the bottom of the scale.
What a grade point is actually worth
Twelve institutions, six different scale maxima, and one thing in common: on every one of them the highest grade point is a band that begins below 100%. The final column shows what the linear rule claims for that same grade point, against what each registrar actually publishes. Each name links to that institution's calculator, which converts against this table rather than a formula.
| Institution | Scale maximum | Top grade | Published band | Linear rule claims | Source |
|---|---|---|---|---|---|
| Fairfield University (US) | 4.00 | A | 93–100% | 100% | Registrar |
| Baruch College, CUNY (US) | 4.00 | A | 93–100% | 100% | Registrar |
| Ave Maria University (US) | 4.00 | A | 93–100% | 100% | Registrar |
| University of Toronto (CA) | 4.00 | A+ | 90–100% | 100% | Registrar |
| Queen's University (CA) | 4.30 | A+ | 90–100% | 100% | Registrar |
| York University (CA) | 9.00 | A+ | 90–100% | 100% | Registrar |
| University of Ottawa (CA) | 10.00 | A+ | 90–100% | 100% | Registrar |
| McMaster University (CA) | 12.00 | A+ | 90–100% | 100% | Registrar |
| Memorial University of Newfoundland (CA) | 4.00 | A | 80–100% | 100% | Registrar |
| Monash University (AU) | 4.00 | HD | 80–100% | 100% | Registrar |
| Australian National University (AU) | 7.00 | HD | 80–100% | 100% | Registrar |
| University of Adelaide (AU) | 7.00 | HD | 85–100% | 100% | Registrar |
The linear estimate, and when it is safe to use
When there is no published table to read, the linear rule is what remains, and it works provided its label stays attached: an estimate, not a conversion. Multiplying a 4.0-scale GPA by 25 produces a number that is defensible as an approximation and indefensible as an official figure.
It behaves best near the top of the scale, where its assumption — that the maximum is a perfect score — is least wrong. A 3.6 returns 90%, a figure that falls inside a published band at every institution in the table above. It behaves worst in the lower half of the scale, where real bands flatten out and compress while the rule keeps descending in a straight line.
Two habits keep it honest. Never report an estimate as your institution's official percentage, and where the form carries consequences — a visa file, a scholarship application, a government recruitment portal — ask your registrar for the conversion in writing instead.
e.g. 3.6 × 25 = 90%.
Not every GPA is out of 4.0
Eleven distinct scale maxima appear across the verified schemes in our database: 4.0, 4.2, 4.3, 4.33, 4.5, 5.0, 5.3, 7.0, 9.0, 10.0 and 12.0. A converter offering only 4.0, 5.0 and 10.0 cannot represent McMaster University's 12-point scale, York University's 9-point scale, or the 4.33 that nineteen verified Canadian institutions use.
Australia shows most clearly that a maximum tells you nothing on its own. Twenty of the twenty-six verified Australian schemes run to 7.0 and six run to 4.0. Monash University's High Distinction is worth 4.0 and starts at 80%; the Australian National University's High Distinction is worth 7.0 and starts at that same 80%. Two maxima, one band — which is only possible because the maximum was never a percentage in the first place.
The number misleads across borders too. The University of Ottawa caps at 10 and York University at 9, both with A+ spanning 90–100%. These are letter-band systems that happen to number their points differently from India's 10-point CGPA, where a different rule applies entirely.
Find your university's published scale
Twelve institutions is a sample, not a directory. Our university pages cover more than a thousand institutions, each with its own scheme and calculator, and the verified ones cite the registrar document the scale was read from.
If yours is not among them, the table you need is usually one search away, though it hides under different names. North American institutions publish it in an academic calendar, an undergraduate catalog or a transcript key, filed under headings like “grading system” or “grades and grading schemes”. Australian universities put it in a grading schema procedure or an assessment policy. Across South Asia it is more often a central examination or semester-system policy than a per-campus page.
Search your institution's site for the letter grade you hold alongside the word “percentage”. What you are looking for is a table with three columns — letter, grade point, and a percentage range. That range is your conversion.
Where an official formula does exist
A few authorities do publish a rule, and they are worth naming precisely because they are so loosely attributed elsewhere. India's UGC, which defined the 10-point CGPA through its Choice Based Credit System guidelines, publishes no percentage conversion at all — the divisors argued over online are institutional, never national.
CBSE's × 9.5 is real but narrow: a school-board rule for the Class-X 10-point CGPA of the CCE era, which CBSE discontinued from 2017. Anna University applies a flat × 10 across its R2013, R2017 and R2021 regulations. VTU's (CGPA − 0.75) × 10 belongs to its 2015, 2017 and 2018 schemes only, and its 2021 and 2022 schemes drop the constant.
Pakistan's HEC publishes the band-minimum convention outright, and its own table places a 3.00 CGPA at 71% — not the 75% that multiplying by 25 would suggest.
Anna University (R2013/R2017/R2021): Percentage = CGPA × 10 — e.g. 8.0 × 10 = 80%.
VTU (2015/2017/2018 schemes): Percentage = (CGPA − 0.75) × 10 — e.g. 8.0 → 72.5%.
HEC (Pakistan, 0–4.00): band lookup — CGPA 3.00 → 71%, the minimum of its band.
Sources: UGC CBCS guidelines (defines the 10-point scale and SGPA/CGPA computation; no conversion formula) · VTU CGPA standard formula · HEC Policy Guidelines §13.1 · CBSE Circular 24/2010 and Anna University ACOE letter 001/ACOE(UDs)/2021, cited by document (no stable public URL). The 10-point direction is covered in full on our CGPA to percentage calculator.
Weighted GPAs, CGPA, and what evaluators actually do
A weighted GPA has no percentage equivalent, and mistaking one for a convertible number is the most common way this calculation produces nonsense. Weighting adds bonus points for honors, Advanced Placement or IB coursework, which is why a weighted figure can climb above the scale maximum. Those bonus points were never marks out of 100; they are an incentive layered on top of the grade. Convert the unweighted GPA, or convert the underlying letter grades one at a time.
The GPA-versus-CGPA distinction matters less here than its prominence elsewhere suggests. A GPA is the credit-weighted average for a single term; a CGPA is the same arithmetic across a whole programme. Both sit on the same scale, so both convert through the same band table.
Worth asking before any of this: does the recipient need a converted percentage at all? Credential evaluators in the NACES network, WES among them, recompute a transcript course by course against the issuing country's system rather than applying a national formula. For admissions abroad the transcript usually travels better than any percentage derived from it.